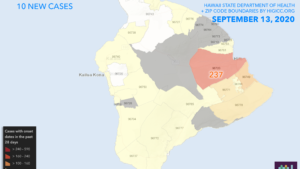
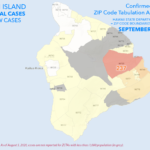
Want to know where COVID-19 cases are on the Big Island? The State Department of Health includes a number of maps in the daily noon update.
The maps show, with color coding, the total number of cases, total cases per 10,000 population, new cases within the last 28 days, cases in the last 28 days per 10,000 population, and tests in the past 28 days per 10,000 population. There is also a list of case counts by island.
The “last 28-day” map is the best way to consider where the residences are of those with active cases.
The challenge now in looking at the “last 28-day” map is that every day since September 5, the State has changed the color coding key. So although each daily map tells the story, one can’t just look at one day to the next and visually see the changes. There is good news, however–the maps on the State website give specific case numbers if you click on an area. The map posted on this page include the zip codes printed on them, courtesy of O’ahu tech guru Ryan Ozawa. For example, Hilo (96720) has had 237 new cases within the last 28 days. Lower Puna, 96749, has had 63. The total case count
Another challenge is that the State no longer reports cases at all for any zip code deemed to have fewer than 1,000 people, and on this island, that includes several zip codes on the Hamakua Coast, plus one in West Hawaii, plus Mauna Kea Reserve Area, Pohakuloa Training Area, and Hawaii Volcanoes National Park:

Click here to see the entire set of maps provided by the State Department of Health, including the original interactive maps. One may also access a whole panoply of other charts and trend information from that site, showing race, age and age trends of those with COVID-19, information on lab testing, hospitalizations, and deaths.
