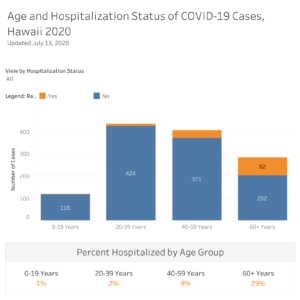
As the case count of people with COVID-19 in the state continues to increase, the number of people who have COVID-19 who are younger than 60 is the largest, but the highest percentage of those hospitalized are those 60 and older, as of last Monday.
This chart is based on the Age Statistic Chart posted on the State Department of Health web site.
As of Saturday morning, July 18, the state’s case count is 1,334. This chart is as of July 13, 2020.
| Ages | Number | Number hospitalized | % hospitalized |
| 0-19 | 119 | 1 | 0.8% |
| 20-39 | 434 | 10 | 2.3% |
| 40-59 | 406 | 35 | 8.6% |
| 60+ | 284 | 82 | 28.9% |
|
Total cases |
1,243 |
The state breakdown for the different age groups looks like this:
